A Smartsheet chart can easily tell you that customer satisfaction is 85% today. What it can't do is show you yesterday's satisfaction at the click of a button.
This is one of my biggest frustrations with Smartsheet: its lack of built-in historical reporting. It will show you live data of today, but there is no built-in button or option to check past data via dashboards or reports, only cell history.
There are a few ways to solve this challenge and I want to focus on an example with RAG today.
The principle to solve it is the same in most cases: Use the automation to record a value and record a date, then count these records in a Smartsheet metrics sheet to be able to display it in a dashboard.
In the case of RAG I was curious to know how a company's RAG was evolving so I did just that:
I built three columns for the RAG Status and 3 matching columns for the dates.
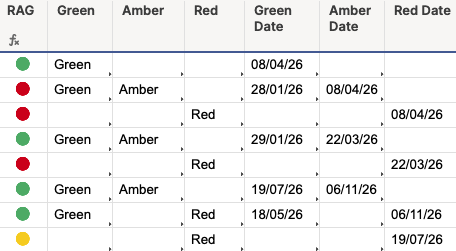
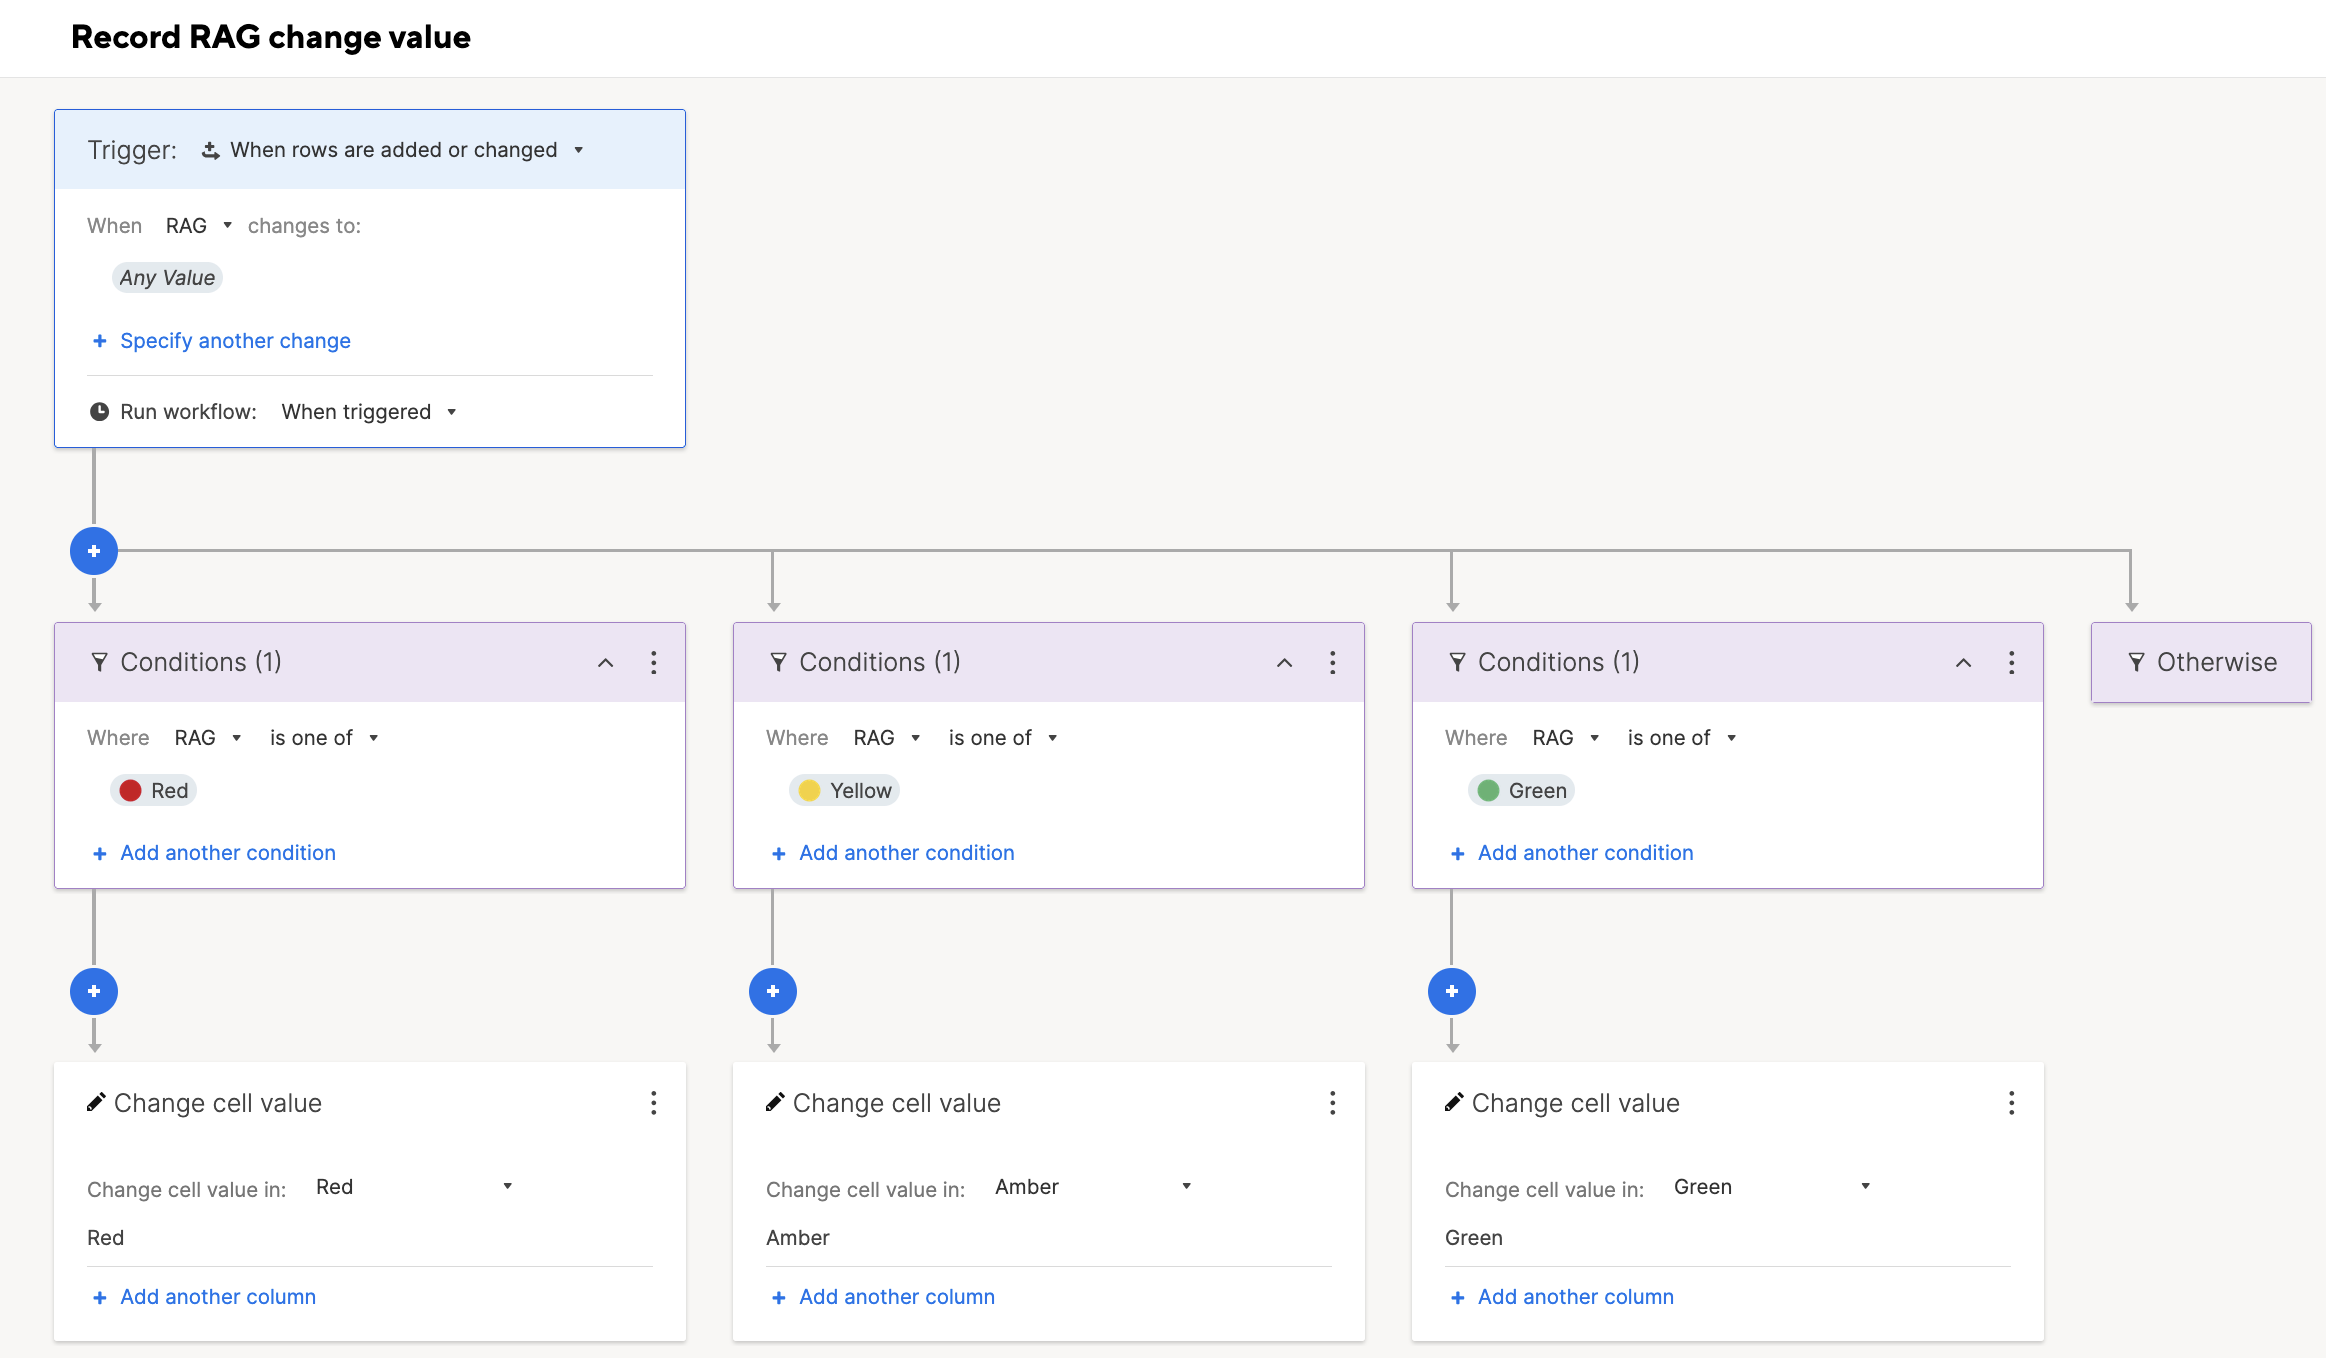
I created 2 automations. One to record the new colour when the RAG column value changes, and one to record the dates.
Then I built a metrics sheet with COUNTIFS formulas for each colour, categorised by month. Here is the formula for the "Count Green" column:
=COUNTIFS({Rag Change - Green}, "Green", {Rag Change - Green date}, IFERROR(MONTH(@cell), 0) = [Month number]@row)
Note that we're grabbing references from the sheet called "Rag Change" (see first screenshot) with the original data.
The trick to make this formula work is to have an IFERROR nested in the COUNTIFS criteria because the MONTH of an empty cell will return an error, which you force-count as a 0.
 All that's left is to use this table in your dashboard, which will show you what new RAGs have accumulated every month:

The dashboard doesn't show the current number of Green projects (you get that in the actual RAG chart). Instead, it shows how many projects moved into each status during a given month, helping you spot trends over time.
This is the simplified version. Whenever you work with dates for example, you have to think ahead so that everything works for the next years. What if you start having data in the January month from both 2025 and 2026?
That's why I'm here. If you need help with Smartsheet, your data, your dashboards, please contact me using the form below.
